Diagrams and Examples
For business programming, with its very flat data structures, diagrams can and should be simple.
Most kinds of data fit well into rectangles; when there are levels, the diagram can nest the levels
When diagrams require many special symbols, the writer carries a burden that often has no benefit.
Likewise, the reader must learn yet another symbology; often a simple word replace a special symbol:
For example, printer main or workstation 5 are both cases where a rectangle with a label conveys the information.
On the other hand, having a few symbols might visually convey a sense of uniformity.
Clarity and Emphasis
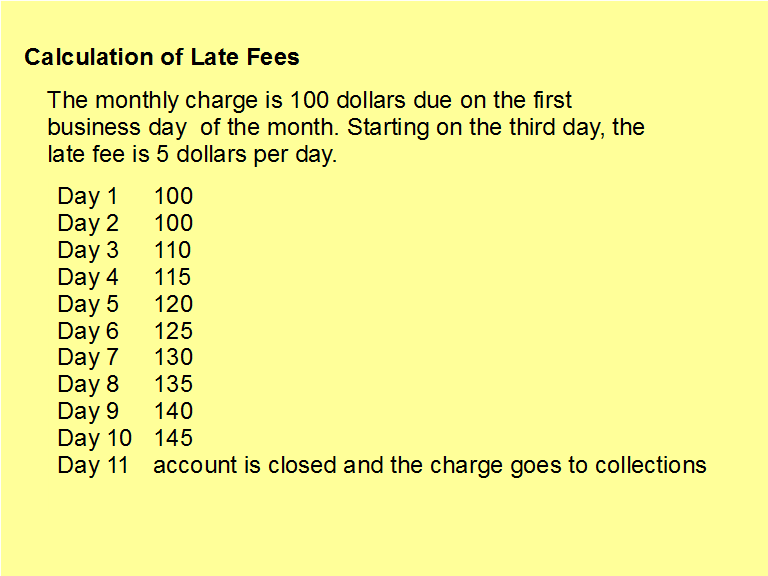
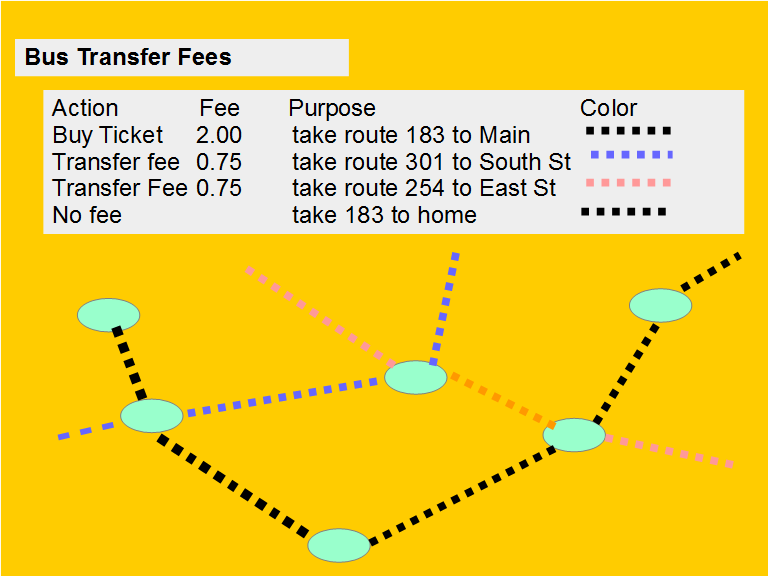
Venn Diagrams can emphasize simple relationships. A decision grid can emphasize the sequence of steps. A chart should bring clarity or emphasis; the effort to build the chart should yield sufficient benefit to offset the cost of the chart. The charts below give meaning to textual specification. In the chart about billing, notice the anomaly on Day 2. Likewise in the chart about the bus, each transfer to a new route costs $0.75. Notice the lack of transfer fees when the transferring back to route 183.
Flowcharts have minimal value
A flow chart of a small routine might have value. A complete flow chart of a big program has little value. The time and effort of producing and arranging the symbols reaps no benefit. Often, a flow chart requires some pseudo-code and some labeling; overall the flowchart might obscure some of the functionality depending on the skill of the designer.
A flow chart of a small routine might have value. A complete flow chart of a big program has little value. The time and effort of producing and arranging the symbols reaps no benefit. Often, a flow chart requires some pseudo-code and some labeling; overall the flowchart might obscure some of the functionality depending on the skill of the designer.

